Sunday, February 17, 2019

MLB 2019 Preview and Betting Guide


The preview and betting guide is now available. It is FREE on my Telegram page. Use this link to get there once you have downloaded Telegram. : 
https://t.me/joinchat/GRon-RYpyXWpD7u06lupgA

There are 170 pages of Baseball! Team previews, recaps, and forecasts for every team. There are articles about run differential, Offensive difficulty, Game Score, Relief pitching, and many more subjects.

Thursday, June 28, 2018

BABIP and how it should be used in handicapping


BABIP: How can we use it in handicapping

The term BABIP is the batting average of batted balls in play. The MLB BABIP average is .298 so we are going to compare pitchers to whether they are above or below that average. 

The idea that BABIP can by itself be a deciding factor is not very accurate. In fact, by itself has very little to the outcome of a game. Relating it to a mindset that everything has a median value and will eventually work towards that median, will be the prevailing use for BABIP. This is an old school thought but not totally lost in concept. Let's see how this works. If a pitcher has a BABIP of .328, he is above the median or "average" .298 discussed above. The prevalent thought is that he will regress back to the average of.298 thus lowering the BABIP. It means that this pitcher will get more outs on batted balls than he has so far. Makes some sense and conceptually is correct. Most handicappers that use BABIP stop here and this how they view run prevention capabilities of that pitcher. Again, that is not entirely inaccurate and can provide great insight into how the game will play out. The theory is that if you are above the average then you have been somewhat unlucky in where the balls were hit. The pitchers that are below the average are considered to have had better luck as the balls hit in play have gone for outs. I think this is not a complete picture. If you combine some other elements of run prevention, you might see that there are reasons for the high or low rates of BABIP and then get a complete picture that can certainly be utilized to ascertain the run prevention capabilities of the pitcher. Let's take this further to get a great handle on it.

Sabermetrics provides another stat called SwStr% (Swing Strike Percentage). It measures the swings batters take and miss the pitches thrown. The MLB average is 10.1%. This is an indication of the quality of pitches the pitcher can throw. Many people describe it as "stuff". You will hear an announcer say "that guy has great stuff". If a pitcher has a below average SwStr% plus a high BABIP, that means his stuff is less quality and the batters are getting good contact with him. Thus, the high BABIP is deserved and not unlucky. It should continue with some variance but still above the average. The opposite is also true. If a pitcher has a high SwStr% and a low BABIP, then his stuff is causing hitters to make poor contact that produces outs. Now let's see if we can go a bit further.

Let's bring in GB% (ground ball percentage). There is a correlation that ground balls produce fewer runs. Although a true statement, ground ball percentage is not by itself a key element to how many runs will get scored. If a pitcher has a high GB%, with a low BABIP and a high SwStr%, then he gets balls in play hit on the ground for outs and batters do not make good contact. This means a lot! It takes 2 hits to score 1 run in MLB. However, if the balls in play are in the air, there is greater likelihood that they will be extra-base hits and may reduce the number of hits required to score. Big edge to those who can keep the ball down. Let's add one more.

We will bring into play hard hit percentage. This measures how often a ball in play was hit soft, medium or hard. The more hard-hit balls, the less quality of pitches the pitcher has. The batters are not getting fooled and are making hard contact. The average is 31.4% in MLB. If a pitcher has a high BABIP, with a low SwStr%, and a low GB%, plus a high hard-hit rate, then he should be set for lots of scoring against him. The balls in play are earned for hits, they are hit in the air, and they are hit hard which will produce extra-base hits and more run-scoring opportunities. 

When we combine measurables that relate to the pitcher's ability to prevent run scoring, we can get a complete picture of the overall ability of the pitcher. BABIP has tremendous value and should be looked at to help determine outcomes of games. It can stand alone, but without some help, we could make judgments that are misleading to complete picture. Make sure to analyze the entire package and not just a component of it.


Tuesday, June 19, 2018

Variance as it relates to Sports Investing


var·i·ance
ˈverēəns/
noun: the fact or quality of being different, divergent, or inconsistent

We see the definition of variance above. The important concept here is two-fold. The inconsistency of human athletes and the difference between our results and expectations. When investing in sports games, poker, or any other casino table game one must realize these investments are mathematical equations that over time will have a median value.  In essence, there will be an average result. In the short term, there will be swings of variance that affect the average result both positively and negatively. These swings are usually described by players as being hot or being cold. These swings are short-term for the investor. An investor sees the process as a daily grind looking for ROI over the year. These short-term swings are not viewed the same way for those that are looking for a scratch-off ticket and wanting to make a fortune without paying their dues. It is certainly not true that everyone has to pay their due before good fortune comes their way, but it is true that if you invest long enough, you will experience variance and expose your bankroll to shortcomings that were not anticipated. 

The key to success is understanding truly what is happening. In general, there HAS to be this process. The reason is that there is a human element involved. You see, as humans, we are not perfect and have all kinds of things that prevent perfection. We have stiff necks, sore backs, bad knees, or just feel sick at times. All of these variables create variance or inconsistency in production. If we were investing in machines or robots, there would be less variance because the output is consistent. Since we humans aren't perfect, we investors must get smart around variance and the effect it has on our psyche. It is very true that you will have more success when your mindset is in such a way that you are viewing things with a positive outlook. Allowing a negative outlook sounds fun in all because you expel some energy, but it is the near-death of an investor. You see, when you are preparing for your daily games, you must have positive mindsets and opinions that are strong because you are about to put hard earned money out there on those opinions. You certainly don't want to support poor opinions and negative thoughts around your investments! 

Sports investing will never be described as beautiful. It is a grind that is not meant for everyone. If it was so easy, there would be hundreds of thousands of professional investors. Sports Investor would be listed on the "jobs to have" reports that college students are handed when they are trying to figure out what degree they should be working towards. We know this isn't the case. This is only for the few. However, as a person trying to benefit from the knowledge of investors, it is crucial to know the culture of sports investing. There are many down times. There are many up times also. As with anything, the up times are exciting and glorious. The down times are just plain a kick in the ass. They are no fun and have you questioning why you're investing in the first place. It reminds me of the picture of the lion where he has just made his kill and had dinner. The caption says "We all want to be a beast until it is time to do what beasts do". 

The investor knows there is a median or average expected outcome. The variance over a time frame is only part of the daily grind he must go through. There is no timetable for these variances. They can go on for only days or weeks, but they can also go on for months. This is a long-term endeavor. The basic rule is, for all the positive variance you enjoyed over that short run or negative variance you had to endure, the median average will ALWAYS rule the odds. If you are struggling, you will again overcome and enjoy a winning stretch. If you are winning, caution to you. You will eventually hit the regression back to the mean, but please maximize your winnings while that streak is happening. Once you truly understand and come to grips with the thought of a marathon versus a sprint, you will survive variance. The truth is, you are not long from being on the upside of the averages! Stay positive and grind out daily. When the variance moves in your direction, you will be more gracious, happier, and much more understanding of truly what it takes to be a sports investor. 


Sunday, June 3, 2018

Box Score Recaps 06/02 and what we can learn! What is ISO?


Box Score Recaps 06/02
What can we learn?

It has become very obvious when you look at MLB games that the game has changed. There are many more strikeouts than hits, extra-base hits / total bases are the keys of the offense to win games and base on balls for hitters are significant plays for 2 reasons. If they occur in front of extra-base hits, they become run-scoring opportunities and they drive up pitch counts on the starting pitcher.

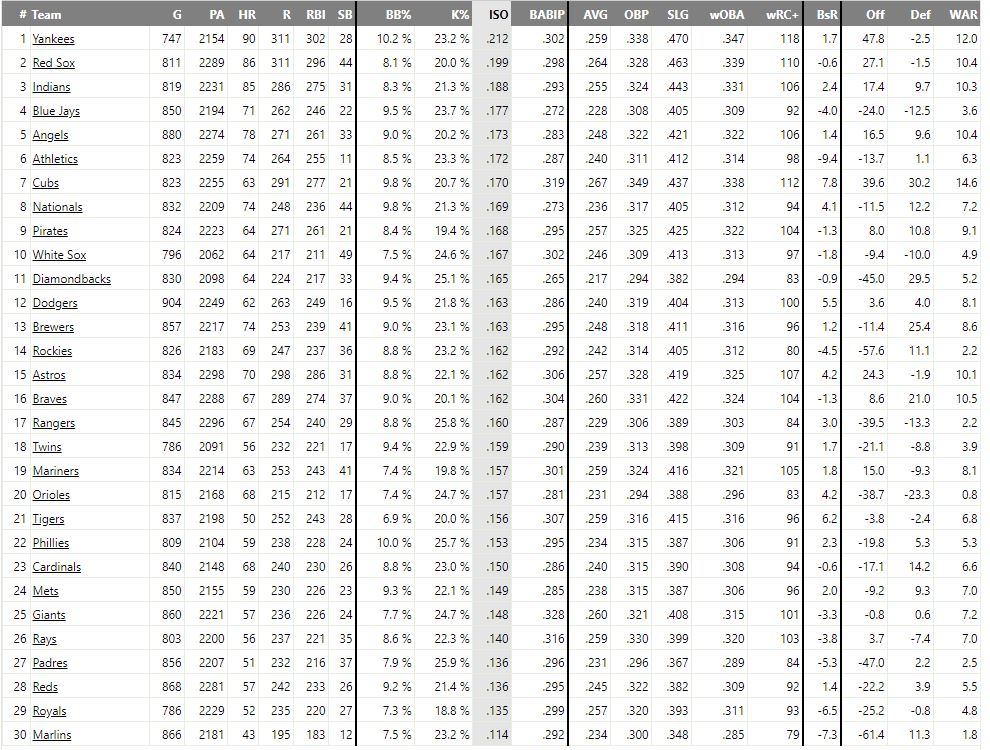
In the CHI @ NYM game, there were no less than 39 strikeouts! As this has become a normalcy in MLB, we should not be getting "flabbergasted" as we show our displeasure for this activity. Instead, we should just count these as regular outs. It is important to know what pitchers will get the strikeouts because that will reduce the number of balls in play. In MLB today, balls in play are more significant to the outcome of the game than they ever have been. It is imperative to know a Saber Metric stat named ISO. It is Isolated Power. The idea is a bit different from slugging percent in that ISO grades each event with more importance, therefore, isolating the value of extra-base hits making each added base significantly more important. The reason ISO and extra-bases hit are valuable is that in general, it takes 2 hits to score one run. If one of those hits is an extra-base hit, often times that is the only hit necessary to score a run! It does happen that teams with fewer hits win games. It is a RARE occurrence to see a team lose a game when they have more total bases than their opponent.


I have included the ranks for all MLB teams on the season for ISO. Please notice that there are only 3 teams with losing records in the top 16! The Dodgers will not have a losing record much longer which will make only 2 losing teams in the top 16! 


Lastly is the base on balls. In the recap for yesterday, teams with more base on balls finished with a record of 9-2! There is something about a "walk" that suggests dejection to a pitcher and a feeling of earning a base for a hitter. Hitters that work counts getting to see many pitches then drawing the walk feel like they "earned" it. It happens to motivate hitters and that seems to be the catalyst for success. Having that edge of motivation against a pitcher who is more dejected does result in winning baseball actions. These valuable "walks" are even more significant when they happen in front of extra-base hits. Now there is no need for 2 hits to score that one run as a walk and an extra-base can get it done.

It is a good exercise to look at the box scores! See what you can learn that can be used to help you win wagers!

Good Luck

Scott  

Sunday, April 1, 2018

Box Score Breakdown for 03/31


03/31 Box Score Breakdown

The idea here is to look at guys on base, total bases, strikeouts (pitcher's control of the game), and total opportunities to score. Those opportunities divided by at-bats gives you how much pressure was put on the opponent's pitcher. It is also a good exercise to see who scored more or less than their projected runs as well.
You will see NYM had high pressure on STL and received minimal pressure from them. STL provided the easiest route to victory for NYM by only applying 32.4% pressure on their pitchers. It is also interesting to see how BBs can make the pressure go up in a game. Look at LAA and OAK.  OAK drew 5 BBs getting their opportunities up to 17 from 12 giving them a 50% pressure rate. They were very close to LAA pressure rate of 51.5% in comparison. Total bases are extremely valuable. Look at CLE who only had 6 hits but still won the game. Their total bases went up and combined with the BBs they drew, gave them more pressure than SEA applied even though SEA had more hits!

This is a good exercise to be in the habit of. Some teams get dominated, some seem dominated but actually aren't. The value in this is to know or learn why a team won or lost. The is valuable information for future reference!


Saturday, March 31, 2018

Why should we care about FIP?

Pitchers who control the game matter

When evaluating MLB games, we must look at many criteria to find edges. There is one that is extremely important. FIP (Fielding Independent Pitching). This is a gauge of how pitchers perform without reliance on their defense. This one thing can be the difference in games! Then there is the xFIP and SIERA which are predictive measures of FIP. The idea is that they can predict future performance and should be used as a dominant factor in handicapping.

Let's look at some games from yesterday box scores to see how this works. 

We 'll start with WSH @ CIN. The final score was 2-0 WSH. However, CIN had 7 hits and WSH only 6. In theory, the score should have been like 4-3 CIN winning. We get this based on 2 hits equals one run. Why did that not happen? We must look at total bases, total opportunities, then strikeouts. 1st for WSH. They had 6 hits, 1 double, 4 BBs, and 6 strikeouts. It means they had 7 total bases, 11 opportunities (total bases plus BBs) with 32 at-bats. The opportunities percentage is 11 / 32 for 34.4% pressure on the pitcher. CIN had 7 hits, 1 double, 2 BBs, and 14 strikeouts. They had 8 total bases, 11 opportunities in 34 at-bats. The opportunities percentage is 11/34 for 32.3% pressure on the pitcher. The pressure percentage is close, but because CIN struck out 14 times, they could not score their runs as needed. The WSH pitchers controlled the game which created the win.

Let's look at NYY @ TOR. The final score was 4-2 NYY. NYY had 8 hits so they should have scored 4 runs as they did. TOR had 5 hits so 2 or 3 runs is their suggested scoring. NYY had 8 hits, 3 doubles, 1 triple, 4 BBs, and 6 strikeouts. Their total bases were 13 plus the 4 BBs for 17 opportunities. They had 33 at-bats. Their opportunities percentage was 51.5%. That is enormous pressure on the pitchers. They only struck out 6 times so the ball was in play. For TOR, they had 5 hits, 4 2bs, 1 hr, 1 BB and 12 strikeouts. They had 12 total bases and 1 BB for 13 opportunities. They had 32 at-bats for opportunities percentage of 40.6%. They had an HR which made scoring easy for at least one of their runs and struck out 12 times lowering the pressure on the pitcher. As you should also see, extra-base hits are premium items for an offense. There is a sabermetric stat for that named ISO. When handicapping, do not overlook the value of ISO!

Ok, two more. This is LAA @ OAK. The final score was LAA 2-1. LAA had 6 hits so they should have had 3 runs and OAK had 7 hits so they should have had 3 or 4 runs. Here is another team with more hits and lost. LAA had 6 hits, 1 HR, 0 BB, and 7 strikeouts. Their total bases were 9 and no BBS so their opportunities are also 9. They had 32 at-bats. Their opportunities percentage was 28.1%. That is not much pressure, but the HR played a major role. OAK had 7 hits, 1 double, 1BB and 8 strikeouts. They had 8 total bases and 9 opportunities. They had 33 at-bats. Their opportunities percentage was 27.3%. Again, not much pressure and no HR. Both teams pitchers were able to control the game but the key was the HR showing the value of ISO.

Last one. PHI @ ATL. The final score was 5-4 PHI. PHI had 10 hits so 5 runs hit the target. They had 10 hits, 2 doubles, 2 home runs, 5 BBs, and 10 strikeouts. They had 18 total bases plus 5 BBs for 23 opportunities. They had 40 at-bats. Their opportunities percentage was 57.5% that is a lot of pressure on ATL pitchers. ATL had 9 hits so 4 or 5 runs is expected which they scored 4. They had 9 hits, 2 doubles, 5 BBs, and 9 strikeouts. They had 11 total bases plus 5 BBs to make 16 opportunities. They had 37 at-bats creating an opportunities percentage of 43.2%. They put pressure on, not nearly as much as PHI did, nor did they have many extra-base hits. PHI won with ISO and pitchers limiting the ISO of the ATL.

So this is how to break down a game once it is over. The goal is to learn how to see this in advance. We want to be on the side of the most opportunities and pressure. As the season goes, data will support a deep dive into this daily. Do all the homework you can. We can not see into the future, but we can get a "feel" for it if we look at the right data. 

Sunday, March 18, 2018

The Chicago White Sox are really starting James Shields Opening Day!

2018 White Sox are in need of major league talent

The 2018 version of the Chicago White Sox are barely the vision of what they can and will be in the future.  This is a team with youthful talent that is not at the big league level yet. They are a group built to dismantle. They are several years from contending, but this year's version is just talent deficient. When James Shields is your opening day starter, that tells you all you need to know. However, let's look at it deeper.

The offense projects 29th, there are only 30 teams! 

They have only 2 batters that project with any significant offensive contributions for 2018. They are circled in red.1B Jose Abreu shows up with 19.6 OFF (RAA). He ranks above average. Avasail Garcia comes in with 6.0 OFF. He ranks average. There are 6 players highlighted. They are negative OFF players and costing the team wins! The rule of thumb is that for every 10 OFF (RAA) there is 1 win. CHW has 5 players costing them wins at or above 1 individually! Even with Abreu and Garcia earning them 2.5 wins, the team total shows -8.7 wins! 

The pitching projects 29th. I guess they did not want to show up the offense.

It is worth noting that Carlos Rodon is out for half the season. He is their best starting pitcher. Look at the highlighted areas. They have 6 of their 9 starters with a projected ERA over 5.00 and a team total over 5.00! They get no support from the relief group as they have only 2 pitchers under 4.00 projected FIP. In this case, does it really matter if 5.36 ERA James Shields is the opening day pitcher when the other veteran guy Gonzalez is 5.19 and the remainder are youngsters with no track record? This team will need to score runs to overcome the pitching and as we have seen, that will be unrealistic to imagine. The future may be bright but 2018 is almost as dark as it can get.