Friday, May 15, 2020

MLB take on the current 2020 season


Can you imagine the headline that might come if there is no MLB season? It might read like this “Millionaire players and billionaire owners disagree on how to share the money so there will not be a season in 2020”. The truth is always in the middle and the tone is of less value than the substance. No one is at fault here. Each side has validity to their stance. However, it is still about how to split up the money amongst already rich people.
It should also be put in the right context. The context surrounding this matter. The players are coming across very poorly in many cases. They are emotional and do not speak with an audience in mind thus they are sounding like sheltered prima donnas. The basis that they are risking their lives is simply wrong. The basis that they will not play unless they get theirs is just a poor statement as it comes off to the public as crying over money when they make so much anyway. Context is that MLB was headed for a great run of seasons, but they have had issues recently that have soured the public audience. Going back to the strike which happened in August 1994 and carried over until April of 1995, baseball has been working extremely hard to regain popularity. We have seen the Montreal Expos shutter, MLB ran the Washing Nationals at first, there were the huge issues with PEDs, and we just are coming off the Houston Astro cheating scandal. Even with all of that, MLB was positioned well. The older players are now gone, and the youth in the game is extremely talented. The money in the game which just two years ago was causing a rift with the players, saw Bryce Harper and Manny Machado sign $300 million dollar contracts and Mike Trout over $400 million. MLB was headed in the right direction. Starts like Ronald Acuna, Juan Soto, Gleyber Torres, Francisco Lindor, and Matt Chapman are at the forefront of leading the way. All the momentum though could be incinerated rather quickly if this now public negotiation does not end well.
Although the players have already agreed to a percentage basis payout for this season, the relevance to the situation has changed. The opening of the states, which is another topic maybe for anther time and the social distancing rules have created an environment where fans and the revenue they bring, will not be included at least in the beginning. None of this is the fault of either side. However, to make an agreement between the two sides, common ground must be found. MLB has gone out of its way to provide the players with a safety protocol so they will feel there is little to no risk of playing. I do not believe there will be issues there. The players will not be saying that they are risking their lives anymore. This was just the wrong thing to say whether they believed it or not. The risks are way to low for them to have this stance, so safety should become a dead issue. All that is left is the money.
MLB has set a schedule and parameters around limiting travel and costs. It is a for-profit business and should try to make as much as they can. MLB offers to split the revenue 50-50 with players is assumed to be another hit in the pocketbook for the players. They agreed to a percentage of games played payout earlier as the spring training was being canceled, thus if there is an 82 game season, they would receive 50% of their contract value. MLB has never shown its books, so we really don’t know what 50% looks like. The players are in the mindset that they will not make the prorated amount and MLB seems to be suggesting that as well. It means they would have another pay cut to absorb. This is the hurdle we may not get past. It likely depends on just how serious anyone wants to play the game and make anything at all. As stated in the opening, it is hard to imagine that a season will be canceled because the revenue can’t be shared. At some point, they need to see into the future and what the reaction to a canceled season for those reasons imply.
The Astros were getting beaten up every at-bat and everywhere they went during spring training by the public who could not stand what they did. Imagine all 30 teams having to go through an ordeal similar. No there would not be that much hatred for every single team as was shown the Astros, but have seen the public comments? They are in no way ready to support a canceled season. Much like the rest of the real world, teams are having financial difficulty. You have seen retail stores, small businesses, and restaurants close permanently due to the shutdown. I am not thinking MLB would permanently close, but things would change dramatically. What if those big contracts were to go away forever? It is a possibility that the sport would not get the buy-in from the public that it had hence the revenue would not be as strong going forward. MLB has already condensed the minor league teams and systems. Would they go even further in this area to eliminate costs? How much would they have to charge to you to attend a game yet still pay the payers? The 2021 season would be so hard to get ramped up with revenues that the 2020 season is imperative to get ironed out. Let alone the near future of the game past 2021. There is a balance that must be found. This is a business that is presented as a game. Make no mistake, people want to make their money. Also, make no mistake; this could awry quickly with large damaging aftershocks that may hurt the existence of the sport. We talk about major sports to include football, baseball, basketball, and hockey. What if it were reduced to only three? It could happen if the groups of people involved today are not extremely careful. I think both sides need to rethink the future before they act on the today and the right answers would be easier to obtain.


Saturday, May 2, 2020

Touts Tipsters Pick Services are one of the major sins a bettor can make!


Look it is very easy to get caught up in the malarky you see in claims and especially all the tweets on Twitter. It is very easy to know who the frauds are, who the claimers are, and who the entertainers are. Sportsbooks limit the guys who win. I  am sure you have seen the complaints, but if you haven't, this is a known issue in the industry. They want as many losing players as possible. These so-called experts are out there showing their ineffectiveness regularly. The margins are too thin for winning players to pay for picks! a -110 line requires a 52.38% win percentage to break even. If you add the price of the selection, that percentage goes up incrementally. You are paying into a line that you expect to make ROI (return on investment). Let's say you invest $500 for a season and the service gives you 100 plays. Each play then has a cost of $5 which should is not very much. Let's say you wager $200 per game and the service wins 54% of the wagers at -110. They won 54 bets at $100 for $5440 and lost 46 at -110 which equals -%5060. You won $380! The problem is that you paid $500 and netted -$120 for a -24% ROI. In theory, there are some services that will keep you afloat, however, they are far and few between. Most are just marketing to get your money.

You need to avoid this situation. There are options. Be careful who you believe in though. It is not 100% necessary to know the person you are getting your info and knowledge from as some of us in the industry are very sharp yet not a known entity. It is also easy for me to tell you that MANY of the known services or industry experts that are widely seen on tv shows, internet programs, or websites that have many so-called experts are previously FAILED touts! In fact, they have grouped together to "hide" amongst the volume of experts to intertwine their performance, thus seemingly providing winning selections. These same groups also charge an exorbitant fee to participate in their shenanigans! These types of services are entertainers. They are NOT going to provide you with the knowledge and skills that you should be acquiring to become a better bettor!

This where the sweet spot comes into play. I have learned that if you are good something you should never do it for free. Certain skill sets are required to become a winning sports bettor. There are several different ways to play. The key elements are to learn, acquire, refine, and duplicate processes that best suit your interests of betting on the games. Whether you want to learn how to handicap teams, games, and situations or you may want to learn how read the market ups and downs, regardless of choice, EastCoastSportsInvestors (ECSI) has solutions for you.

We have created our own network so we can address via specific channels every major sport. I do my work through data analysis and handicapping teams, players, games, and so forth. I have written models and algorithms that help project the results, but it is about knowing what to do with the information. It is also necessary to understand what data is important what data is not important. Notice I did not talk about trends, systems, and meaningless historical data points. This current, fresh, and state of the art material. Most everything is done via Sabermetrics and advanced football statistics. Jeff uses the methodology of the betting market. Why does the money come in on one side yet the line doesn't move? What does it mean when the line does move? Who is betting on into the lines? Jeff does analysis on the betting market and can answer these questions! The idea is that he can tell you what is going behind the scenes and where value is based on the moves in the line. We are all looking for value. That is what we are going to wager on. 

Please do NOT fall into the trap of listening to the FREE guys either! FREE is not valuable. These are guys that are wanting to have large followers and be a "known" Twitter capper. The bettors that follow these guys are not major players nor are they players that will do anything but look for the free stuff. That is their game. They are getting over on the bettors who pay for plays. Right! FREE is that way for a reason. They are not confident enough nor are they winning enough to have a skill set that is valuable enough that someone else would pay for! Simple as that. You will only learn that they are learning just like you are learning.

Be the smart ones. Be the ones that are NEXT LEVEL. Learn how to do this the right way. Become informed, educated, and sharp in the way you approach your investing. ECSI has the environment for you. Use this address: https://www.eastcoastsportsinvestors.com/plans-pricing-1 and sign up for the Back to Basics plan. It is only $29.99 per month. We will educate you on your journey to becoming the NEXT LEVEL. We will answer your questions. We provide analysis. We provide the wagers we have made. We will lead you down the path. It is all about your thought process and what you should be looking at! We WILL help you!


Thursday, March 26, 2020

Totals Projections


Totals Projections for an Individual Game

When making a totals line there are several things, we need to consider most of which are driven by the starting pitcher. We also need input from the bullpen as they will dictate how the game ends. I believe in the statistical approach.
I know that it takes roughly 2.1 hits to score one run, but I will use 2.0 hits as rule here and makes math much simpler. Any starting pitcher stats will show hits allowed so that is an easy number to get or calculate. We do really care about innings because there are times where games started will skewed and cannot give an accurate account of games (for example, SP who previously was a relief guy so he will show large innings but not many games started). We can provide ourselves with relatively accurate games started number to use by taking the innings pitched then divide them by 6. The result will give an estimated number of games started which will be accurate enough for our equations. We are going to use the formula of hits divided by games started so we can get hits per game number for the starting pitcher and we will do a very similar thing for the bullpen. Now we must decide on the influence and or types of game data to use to create this model.
It will be easier for me to show in a graph, so the following picture is my graphs for each pitcher. I use the last 30 days, L5 starts vs Opp., L3 years vs Opp. (vs OPP), Day if applicable, and home/away splits.

The example shows Mile Mikolas and Dallas Keuchel. The figures on the far right show the calculations that produce the run expected total for each pitcher. Miles Mikolas is expected to allow 3.2 runs and Dallas Keuchel 2.7 runs in this example. The data in the column on the left is the hits divided by 2 (using or data methodology from above) then added and averaged for a total. The second column is the innings pitched divided by 6 which produces our games started data. We divide the runs expected by the games started to get runs per game result. Keep in mind this is only half of the equation because the bullpen too will have allowed runs. It is a much simpler process. We are not singling out on players; we are using their collective data as a group. We will look at their last 14 days of work getting the number of games played in that span. We will then simply look at how many hits they have allowed. We will divide the hist by 2, then that total by the number of games they have played in the last 14 days. It will also give a total runs expected from the bullpen.
We will use the string pitcher expected runs, then add the bullpen expected runs to get total runs expected to allow for each team. We then add them together to get a total runs expected. There is also one other data point we must consider which is BB. BB on can create more opportunities for offenses to score runs but usually, they produce big innings of run-scoring as well. Looking at the data, I have learned that if we can project double-digit BBs between both teams, we need to add 2.5 runs to our projected total. When games get that many BBs in them, the scoring does go up, we can get an the edge here if we can predict it.
Using the same process as before, we already have the games started number, we need to total the BB categories then divide by the number of categories. In the case of the example, Mikolas has 4 categories and Keuchel only 3. Mikolas has 35 BB divided by 4 categories returns a value of 8.75 We then take that total our games started figure. IN Mikolas case we get 8.75 divided by 7.10 returning 1.23 BB per game. Keuchel has 24BBs divided by 3 categories for a value of 8.00. We divide that by 5.17 and returns a value of 1.55. Add them together and we get 2.78 BBs from the starters.  In the example, neither pitcher will have a high walk rate. Neither bullpen increases the numbers to double-digit BB expectations, so in this example, we are adding no additional runs.
The example will show that Mikolas should be expected to allow 3.2 runs and their bullpen 2.06 for a total of 5.26 runs allowed. Keuchel should be expected to allow 2.7 runs and their bullpen 1.54 for a total of 4.2 runs allowed. We have now an expectation that we should see 9.46 runs or our line of 9.5.
The actual line in this game was 7.5. The result was STL 7 and ATL 6.  


Wednesday, March 18, 2020

101 Making your own line


MLB Handicapping 101

Step #1 Make your own line
It is IMPERATIVE to make your own line when handicapping sports. It is even more so in MLB because the differentiator is usually how to evaluate pitchers, not teams. There are many sports where all that is necessary is team evaluation where a spread is involved. MLB is different. The team part is relative to the other sports but knowing the pitchers is crucial.
I would like to say I have the very best approach but it is not mine at all. I stole and refined it. I use a 3-step method 1st published by Joe Peta in the book Trading Bases. It is a financial world calculation to get the team evaluations, then a starting pitcher evaluation, and finally a home team edge. Joe was originally a financial trader on Wall St. He was hit by a car and spent a summer away, thus focusing his energy and thoughts on baseball. Let’s get into his model so you can make your own lines that are what I consider the “True” line. A true line is where there is no other influence. A sportsbook will make their line with influence on where they want you to wager or protect where they do not want wagers.  A true line is the most accurate of the teams and players and often will expose the line of the sportsbook. I will share an example from the MLB 2019 playoffs shortly.
We need a team evaluation to get the basis for our line. Based on my own research over the years, it is best to use the Sabermetric predictions and not the actual results. Over the course of the season, these will mirror each other, but especially the first half of the season, you will see some variance in team strength between these predicted results and the sportsbook. Don’t fear that. We want that variance as that will soon be one of our edges over the sportsbook! Team evaluation is based on FanGraphs Projected Standings winning percentage for each team. For the example I am going to provide, STL @ ATL 10/3 2019 Mikolas vs Keuchel, we need the winning percentage of each team. STL was .537 and STL was .556. Based on these winning percentages, we can formulate each team winning probability. That requires a formula.
                Formula for STL winning probability: (STL*(1-ATL)/((STL*(1-ATL)+(ATL(*1-STL)
                Formula for ATL winning probability: (ATL*(1-STL)/((STL*(1-ATL)+(ATL(*1-STL)
The result will look like this. STL win probability is 48.08% and ATL is 51.92%. We will adjust these later. The line for this game was ATL Keuchel -143 and a total of 7.5. Using an Odds converter, we can convert the win probability of 51.92% to a money line. In this case, it comes out to ATL -108. Right off the start, you can see where there is some value. We will adjust ATL up later due to their home field later.
Now we must properly evaluate the starting pitchers who will have the most impact on the line. This is the most important part of making the line accurate.  The way I do this is based on the WAR the pitcher has contributed to the staff. I total the staff WAR then divide the starting pitcher contribution to it, which then becomes the adjustment we must make to the team winning percentage. I use any pitchers that are projected to have started 5 games. Again, we are using the projected results. The purpose of the projected results is to eliminate human variance. We can get enamored in the “what we have last seen” syndrome and often over or under evaluate a pitcher by his true results. WAR is a statistic that measures a player's contribution to wins so it fits right into this extremely well. In this case, STL has 12.2 WAR and ATL 12.3 WAR. Mikolas has 2.8 WAR and Keuchel 1.2 WAR. We are now going to add or in some cases subtract the value of a starting pitcher to the team winning percentage. That requires another formula.
                Formula for Mikolas: (((2.8*5)-12.2)/162)+.537
                Formula for Keuchel: (((1.2*5)-12.3)/162+.556
The results are a new winning percentage of .548 for STL and .517 for ATL with new winning probabilities of STL 53.11% and ATL 46.89%. Now we are seeing the true value of evaluating pitchers! We now have STL as the favorite!
We now must adjust for home field. That adjust is a formula where the home team gets 2.75% added to their win probability. That is worth nearly 15 on the money line and is an adjustment I have made as Joe Peta’s version was too low.
Now we have completed analysis where ATL is 49.64%-win probability and STL is 50.36%. The true line should be STL -101 and the sportsbook line is ATL -143! We can bet on STL +123 at a tremendous value! The outcome in this game was STL 7 ATL6. Winner!
My spreadsheet does all the math for me and presents it like this:

I do this for every single game. It gives me a direction to look and prepare for. I then do more matchup analysis to either support this line or to find flaws. The more support to it the bigger I will wager.

Thursday, March 12, 2020

Sabermetrics vs StatCast


Sabermetrics vs StatCast Metrics

Sabermetrics are sound and true results of specific data that either show results or can be used to predict future results. Data such as wOBA, wRC+, wRAA, and WAR are staples of Sabermetric data. We can use them in prognostication and handicapping games or teams. Data such as FIP, SIERA and xFIP are staples of pitching performance. This data separates players and teams by specific criteria which in turn then handicaps strengths and weaknesses so we can find value to wager on.

StatCast metrics are the results of specific actions. They have measured velocities of balls hit off bats or how many times the barrel of the bat hits the ball. This data is NOT very useful in daily wagering whatsoever. Sabermetrics does have data representing hard-hit rates, medium hit rates and soft hit rates so why does it really matter what the arch of the ball flight was, or how many mph exit velocity was?

The way I see and have heard MLB managers speak of StatCast measures is in terms of process. StatCast has a metric called xwOBA. It is a predictor for weighted on base percentage. The calculation is Quality of contact + K + BB. This data does not pinpoint to trueness worthy of making wagers. It is specific to players, not teams. Looking from the pitcher side, there is data showing previous results against the batters they will face so maybe a predictive value there. MLB managers know of this data and they use it for the process of hitting or pitching. The theory is that if a player is following a good process, his numbers will get better because from batter to batter or pitch to pitch it is sound. It makes sense to me. But it does not indicate anything regarding the quality of the player or team. It does to a degree indicate positive or negative results that should come. How soon?

Sabermetrics can do similar things regarding xFIP. I can see where a pitcher is going to get in trouble and where he is dominant. I can also bet on those edges. I can combine data for pitchers so it flows together, and I can see the process! FIP, + GB%, + BB%, +K%, + O-Swing%, +SwStr%+, hard-hit rate, and BABIP. This data will tell me how he controls the game from the mound, how many runners he should allow, how hitters fair against his pitches, whether the ball takes flight when hit and more! Sabermetrics is specific. When grouped together, you can tell a story and get a reasonable conclusion on how teams and players are going to perform.  I can specifically indicate a team is 11% better offensively using Sabermetrics which is a very clear edge. There is no such thing in StatCast data. Barrels, exit velocity, and xwOBA are all nice things and might have value to the Fantasy world, but there is not much value to this data in sports wagering.

If you are interested in learning how to do this, I have a Discord channel where we discuss this plus, I give out daily selections. It is $29.99 per mo.


You can follow me on Twitter @Webbie20MLB

Tuesday, February 25, 2020

Team Wins is real value


Starting pitchers need to be looked at via Team Wins, not personal wins!

MLB investing oftentimes is about your team winning the game. In many cases there is no spread as we use the Money Line most often, thus a winning ticket just needs your team to win the game. A starting pitcher's personal won-lost record is 100% meaningless to our goal. The following charts will indicate this. Likewise, if we just use his value in the team starts, we can actually start getting an edge. 

A team win is earned for the starting pitcher in any game for which he started and the team wins. Sure this record does not give us value he produced in terms of quality, but we have other measures for that. This does tell us that he pitched well enough for his team to win the game.  This is exactly what we are trying to accomplish! 

The first chart is the team win pct% win the starter pitches a game. The 2nd chart is his personal won-lost record. There are some very interesting findings and maybe some that are just obvious. The number one pitcher was MIL Brandon Woodruff. I bet you would not have seen that coming! He made 22 starts and his team won 18 of those starts. He personally only won 11 games. The value is knowing that if you bet on him last season, you would have won 81.8% of your wagers! CLE Adam Plutko is ranked 9th! He made 20 starts and his team won 14 of them! Again, another guy who you would have underestimated his value to your bankroll. 

On the other side of that coin are guys like TEX Lance Lynn. He ranked 11th in wins. However, his team won only 1 more game than they lose when he was on the mound. His win total was 16 and his team's win total was 17 while losing 16 times when he started. Another one is SEA Marco Gonzalez who ranked 12th in wins with 16. His team had 17 wins when he started and they also had 17 losses. Below are the charts of the top 35 guys in both teams win % and personal won-lost record. FOr us gamblers,  there is value in certain results we just have to know what to look for!  


Tuesday, February 18, 2020

The MOST underrated aspect of MLB handicapping is simply OFFENSE!


The MOST underrated aspect of MLB handicapping is simply OFFENSE!

MLB handicappers spend most of their time (and rightfully so) on the games starting pitchers. The starting pitcher quality determines the lines and therefore should get the majority of the work. Baseball today has a larger comparison that goes unnoticed by too many though. When most people, let alone handicappers, can teel you the variance quality of the starting pitchers, very few even look at the offenses. This is a large mistake and a missed opportunity. Just like the pitchers, there is variance in an offense that can be used for handicapping games. 

Let's just say that Team A is playing Team B where both pitchers are #4 starters and there is not much variance in their quality. This will set a line something line Team A -125 because they are the home team. What if I told you that Team B was currently #5 in wRAA, #3 in wOBA and #4 in wRC+? Then I told you team A was ranked 24th in all those categories across the board. Would that matter to you? Based on the topic of this article, the answer to that question is it should matter.

In many cases, there are larger advantages for a team in the offense than there is in the pitching. This can come into play in a game like the one above where the pitching is equal, or it can come into play when considering the value of an underdog against a quality team that is slumping at the plate. It is important to know what to look for though. A team with an HR edge is simply not a situation that really matters. Sabermetrics has well-defined stats for specific things is those stats measure. wRAA (Weighted Runs Above Average) measures the number of runs a player contributes to his team above an average player. Comparing teams, it is the number of runs above an average offense this team is! This is very useful information. wOBA (Weighted On Base Average) gives credit to the batter for each outcome individually not treating a hit or an at-bat as one thing, thus an extra-base hit has more value. It is a better stat than OBP, batting average, or RBI. It is a "catch-all" stat to provide the hitter's comprehensive offensive value. wRC+ (Weighted Runs Created Plus) is very similar to wRAA however it is shown on a scale where 100 is average, thus you will a 104 wRC+. It means that the team creates runs 4% better than an average team does. It is calculated much the same where the individual value of outcomes matters. 

Using these scales and data points, we will get a very clear picture of the offensive edge a team has on its opponent. We can match the offense up to the pitcher's 3 true outcomes strategies. We can quantify run variances based on offensive output, which in turn will allow us to make wagers based on the strength of an offense over the opponent. It works like this. Team A has -2.2 wRAA, 87 wRC+ and .290 wOBA. It means they are 2 runs worse than an average offense, 13% worse than an average offense and .050 (avg is .347) worse in overall offensive value. If Team B has and averages everything, they are minimally 2 runs better with a stretch to 3. If they are above average, they are likely 3-4+ runs better. Now we can make wagers. If the starting pitcher can not affect the scoring probabilities enough, we can easily see where the value is. 

Sure there are more elements to this like ISO, BB% and K% to name some, but the premiss is to illustrate the value of evaluating a team on offense as it oftentimes will be an overlooked aspect of the game where some opportunities have left on the table. 


Sunday, February 17, 2019

MLB 2019 Preview and Betting Guide


The preview and betting guide is now available. It is FREE on my Telegram page. Use this link to get there once you have downloaded Telegram. : 
https://t.me/joinchat/GRon-RYpyXWpD7u06lupgA

There are 170 pages of Baseball! Team previews, recaps, and forecasts for every team. There are articles about run differential, Offensive difficulty, Game Score, Relief pitching, and many more subjects.

Thursday, June 28, 2018

BABIP and how it should be used in handicapping


BABIP: How can we use it in handicapping

The term BABIP is the batting average of batted balls in play. The MLB BABIP average is .298 so we are going to compare pitchers to whether they are above or below that average. 

The idea that BABIP can by itself be a deciding factor is not very accurate. In fact, by itself has very little to the outcome of a game. Relating it to a mindset that everything has a median value and will eventually work towards that median, will be the prevailing use for BABIP. This is an old school thought but not totally lost in concept. Let's see how this works. If a pitcher has a BABIP of .328, he is above the median or "average" .298 discussed above. The prevalent thought is that he will regress back to the average of.298 thus lowering the BABIP. It means that this pitcher will get more outs on batted balls than he has so far. Makes some sense and conceptually is correct. Most handicappers that use BABIP stop here and this how they view run prevention capabilities of that pitcher. Again, that is not entirely inaccurate and can provide great insight into how the game will play out. The theory is that if you are above the average then you have been somewhat unlucky in where the balls were hit. The pitchers that are below the average are considered to have had better luck as the balls hit in play have gone for outs. I think this is not a complete picture. If you combine some other elements of run prevention, you might see that there are reasons for the high or low rates of BABIP and then get a complete picture that can certainly be utilized to ascertain the run prevention capabilities of the pitcher. Let's take this further to get a great handle on it.

Sabermetrics provides another stat called SwStr% (Swing Strike Percentage). It measures the swings batters take and miss the pitches thrown. The MLB average is 10.1%. This is an indication of the quality of pitches the pitcher can throw. Many people describe it as "stuff". You will hear an announcer say "that guy has great stuff". If a pitcher has a below average SwStr% plus a high BABIP, that means his stuff is less quality and the batters are getting good contact with him. Thus, the high BABIP is deserved and not unlucky. It should continue with some variance but still above the average. The opposite is also true. If a pitcher has a high SwStr% and a low BABIP, then his stuff is causing hitters to make poor contact that produces outs. Now let's see if we can go a bit further.

Let's bring in GB% (ground ball percentage). There is a correlation that ground balls produce fewer runs. Although a true statement, ground ball percentage is not by itself a key element to how many runs will get scored. If a pitcher has a high GB%, with a low BABIP and a high SwStr%, then he gets balls in play hit on the ground for outs and batters do not make good contact. This means a lot! It takes 2 hits to score 1 run in MLB. However, if the balls in play are in the air, there is greater likelihood that they will be extra-base hits and may reduce the number of hits required to score. Big edge to those who can keep the ball down. Let's add one more.

We will bring into play hard hit percentage. This measures how often a ball in play was hit soft, medium or hard. The more hard-hit balls, the less quality of pitches the pitcher has. The batters are not getting fooled and are making hard contact. The average is 31.4% in MLB. If a pitcher has a high BABIP, with a low SwStr%, and a low GB%, plus a high hard-hit rate, then he should be set for lots of scoring against him. The balls in play are earned for hits, they are hit in the air, and they are hit hard which will produce extra-base hits and more run-scoring opportunities. 

When we combine measurables that relate to the pitcher's ability to prevent run scoring, we can get a complete picture of the overall ability of the pitcher. BABIP has tremendous value and should be looked at to help determine outcomes of games. It can stand alone, but without some help, we could make judgments that are misleading to complete picture. Make sure to analyze the entire package and not just a component of it.


Tuesday, June 19, 2018

Variance as it relates to Sports Investing


var·i·ance
ˈverēəns/
noun: the fact or quality of being different, divergent, or inconsistent

We see the definition of variance above. The important concept here is two-fold. The inconsistency of human athletes and the difference between our results and expectations. When investing in sports games, poker, or any other casino table game one must realize these investments are mathematical equations that over time will have a median value.  In essence, there will be an average result. In the short term, there will be swings of variance that affect the average result both positively and negatively. These swings are usually described by players as being hot or being cold. These swings are short-term for the investor. An investor sees the process as a daily grind looking for ROI over the year. These short-term swings are not viewed the same way for those that are looking for a scratch-off ticket and wanting to make a fortune without paying their dues. It is certainly not true that everyone has to pay their due before good fortune comes their way, but it is true that if you invest long enough, you will experience variance and expose your bankroll to shortcomings that were not anticipated. 

The key to success is understanding truly what is happening. In general, there HAS to be this process. The reason is that there is a human element involved. You see, as humans, we are not perfect and have all kinds of things that prevent perfection. We have stiff necks, sore backs, bad knees, or just feel sick at times. All of these variables create variance or inconsistency in production. If we were investing in machines or robots, there would be less variance because the output is consistent. Since we humans aren't perfect, we investors must get smart around variance and the effect it has on our psyche. It is very true that you will have more success when your mindset is in such a way that you are viewing things with a positive outlook. Allowing a negative outlook sounds fun in all because you expel some energy, but it is the near-death of an investor. You see, when you are preparing for your daily games, you must have positive mindsets and opinions that are strong because you are about to put hard earned money out there on those opinions. You certainly don't want to support poor opinions and negative thoughts around your investments! 

Sports investing will never be described as beautiful. It is a grind that is not meant for everyone. If it was so easy, there would be hundreds of thousands of professional investors. Sports Investor would be listed on the "jobs to have" reports that college students are handed when they are trying to figure out what degree they should be working towards. We know this isn't the case. This is only for the few. However, as a person trying to benefit from the knowledge of investors, it is crucial to know the culture of sports investing. There are many down times. There are many up times also. As with anything, the up times are exciting and glorious. The down times are just plain a kick in the ass. They are no fun and have you questioning why you're investing in the first place. It reminds me of the picture of the lion where he has just made his kill and had dinner. The caption says "We all want to be a beast until it is time to do what beasts do". 

The investor knows there is a median or average expected outcome. The variance over a time frame is only part of the daily grind he must go through. There is no timetable for these variances. They can go on for only days or weeks, but they can also go on for months. This is a long-term endeavor. The basic rule is, for all the positive variance you enjoyed over that short run or negative variance you had to endure, the median average will ALWAYS rule the odds. If you are struggling, you will again overcome and enjoy a winning stretch. If you are winning, caution to you. You will eventually hit the regression back to the mean, but please maximize your winnings while that streak is happening. Once you truly understand and come to grips with the thought of a marathon versus a sprint, you will survive variance. The truth is, you are not long from being on the upside of the averages! Stay positive and grind out daily. When the variance moves in your direction, you will be more gracious, happier, and much more understanding of truly what it takes to be a sports investor. 


Sunday, June 3, 2018

Box Score Recaps 06/02 and what we can learn! What is ISO?


Box Score Recaps 06/02
What can we learn?

It has become very obvious when you look at MLB games that the game has changed. There are many more strikeouts than hits, extra-base hits / total bases are the keys of the offense to win games and base on balls for hitters are significant plays for 2 reasons. If they occur in front of extra-base hits, they become run-scoring opportunities and they drive up pitch counts on the starting pitcher.

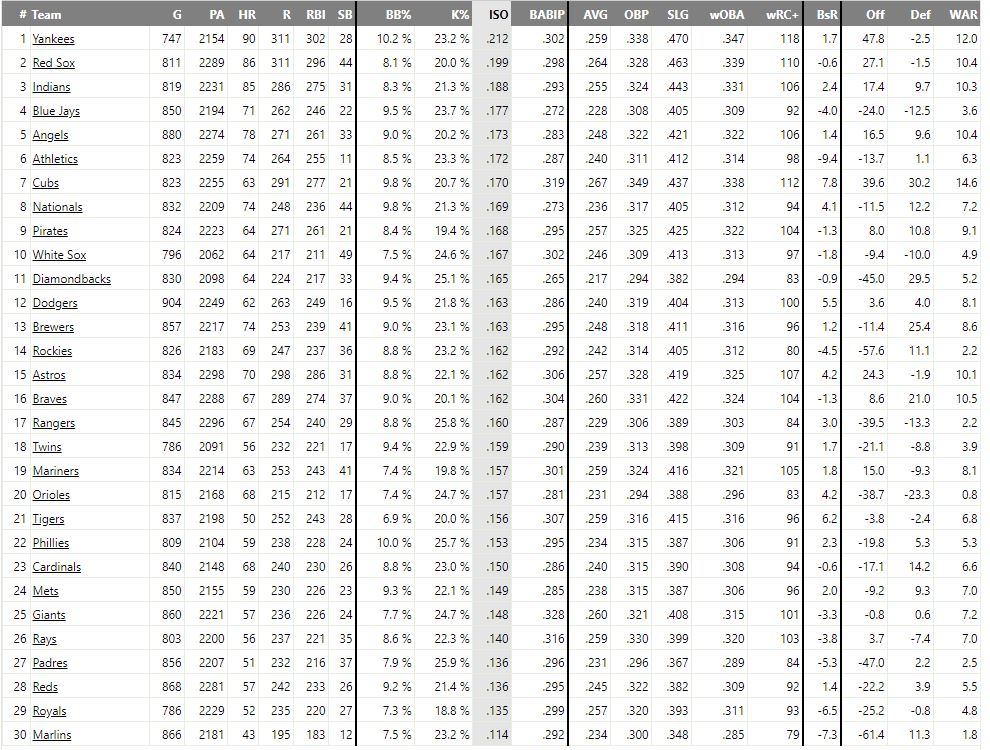
In the CHI @ NYM game, there were no less than 39 strikeouts! As this has become a normalcy in MLB, we should not be getting "flabbergasted" as we show our displeasure for this activity. Instead, we should just count these as regular outs. It is important to know what pitchers will get the strikeouts because that will reduce the number of balls in play. In MLB today, balls in play are more significant to the outcome of the game than they ever have been. It is imperative to know a Saber Metric stat named ISO. It is Isolated Power. The idea is a bit different from slugging percent in that ISO grades each event with more importance, therefore, isolating the value of extra-base hits making each added base significantly more important. The reason ISO and extra-bases hit are valuable is that in general, it takes 2 hits to score one run. If one of those hits is an extra-base hit, often times that is the only hit necessary to score a run! It does happen that teams with fewer hits win games. It is a RARE occurrence to see a team lose a game when they have more total bases than their opponent.


I have included the ranks for all MLB teams on the season for ISO. Please notice that there are only 3 teams with losing records in the top 16! The Dodgers will not have a losing record much longer which will make only 2 losing teams in the top 16! 


Lastly is the base on balls. In the recap for yesterday, teams with more base on balls finished with a record of 9-2! There is something about a "walk" that suggests dejection to a pitcher and a feeling of earning a base for a hitter. Hitters that work counts getting to see many pitches then drawing the walk feel like they "earned" it. It happens to motivate hitters and that seems to be the catalyst for success. Having that edge of motivation against a pitcher who is more dejected does result in winning baseball actions. These valuable "walks" are even more significant when they happen in front of extra-base hits. Now there is no need for 2 hits to score that one run as a walk and an extra-base can get it done.

It is a good exercise to look at the box scores! See what you can learn that can be used to help you win wagers!

Good Luck

Scott  

Sunday, April 1, 2018

Box Score Breakdown for 03/31


03/31 Box Score Breakdown

The idea here is to look at guys on base, total bases, strikeouts (pitcher's control of the game), and total opportunities to score. Those opportunities divided by at-bats gives you how much pressure was put on the opponent's pitcher. It is also a good exercise to see who scored more or less than their projected runs as well.
You will see NYM had high pressure on STL and received minimal pressure from them. STL provided the easiest route to victory for NYM by only applying 32.4% pressure on their pitchers. It is also interesting to see how BBs can make the pressure go up in a game. Look at LAA and OAK.  OAK drew 5 BBs getting their opportunities up to 17 from 12 giving them a 50% pressure rate. They were very close to LAA pressure rate of 51.5% in comparison. Total bases are extremely valuable. Look at CLE who only had 6 hits but still won the game. Their total bases went up and combined with the BBs they drew, gave them more pressure than SEA applied even though SEA had more hits!

This is a good exercise to be in the habit of. Some teams get dominated, some seem dominated but actually aren't. The value in this is to know or learn why a team won or lost. The is valuable information for future reference!


Saturday, March 31, 2018

Why should we care about FIP?

Pitchers who control the game matter

When evaluating MLB games, we must look at many criteria to find edges. There is one that is extremely important. FIP (Fielding Independent Pitching). This is a gauge of how pitchers perform without reliance on their defense. This one thing can be the difference in games! Then there is the xFIP and SIERA which are predictive measures of FIP. The idea is that they can predict future performance and should be used as a dominant factor in handicapping.

Let's look at some games from yesterday box scores to see how this works. 

We 'll start with WSH @ CIN. The final score was 2-0 WSH. However, CIN had 7 hits and WSH only 6. In theory, the score should have been like 4-3 CIN winning. We get this based on 2 hits equals one run. Why did that not happen? We must look at total bases, total opportunities, then strikeouts. 1st for WSH. They had 6 hits, 1 double, 4 BBs, and 6 strikeouts. It means they had 7 total bases, 11 opportunities (total bases plus BBs) with 32 at-bats. The opportunities percentage is 11 / 32 for 34.4% pressure on the pitcher. CIN had 7 hits, 1 double, 2 BBs, and 14 strikeouts. They had 8 total bases, 11 opportunities in 34 at-bats. The opportunities percentage is 11/34 for 32.3% pressure on the pitcher. The pressure percentage is close, but because CIN struck out 14 times, they could not score their runs as needed. The WSH pitchers controlled the game which created the win.

Let's look at NYY @ TOR. The final score was 4-2 NYY. NYY had 8 hits so they should have scored 4 runs as they did. TOR had 5 hits so 2 or 3 runs is their suggested scoring. NYY had 8 hits, 3 doubles, 1 triple, 4 BBs, and 6 strikeouts. Their total bases were 13 plus the 4 BBs for 17 opportunities. They had 33 at-bats. Their opportunities percentage was 51.5%. That is enormous pressure on the pitchers. They only struck out 6 times so the ball was in play. For TOR, they had 5 hits, 4 2bs, 1 hr, 1 BB and 12 strikeouts. They had 12 total bases and 1 BB for 13 opportunities. They had 32 at-bats for opportunities percentage of 40.6%. They had an HR which made scoring easy for at least one of their runs and struck out 12 times lowering the pressure on the pitcher. As you should also see, extra-base hits are premium items for an offense. There is a sabermetric stat for that named ISO. When handicapping, do not overlook the value of ISO!

Ok, two more. This is LAA @ OAK. The final score was LAA 2-1. LAA had 6 hits so they should have had 3 runs and OAK had 7 hits so they should have had 3 or 4 runs. Here is another team with more hits and lost. LAA had 6 hits, 1 HR, 0 BB, and 7 strikeouts. Their total bases were 9 and no BBS so their opportunities are also 9. They had 32 at-bats. Their opportunities percentage was 28.1%. That is not much pressure, but the HR played a major role. OAK had 7 hits, 1 double, 1BB and 8 strikeouts. They had 8 total bases and 9 opportunities. They had 33 at-bats. Their opportunities percentage was 27.3%. Again, not much pressure and no HR. Both teams pitchers were able to control the game but the key was the HR showing the value of ISO.

Last one. PHI @ ATL. The final score was 5-4 PHI. PHI had 10 hits so 5 runs hit the target. They had 10 hits, 2 doubles, 2 home runs, 5 BBs, and 10 strikeouts. They had 18 total bases plus 5 BBs for 23 opportunities. They had 40 at-bats. Their opportunities percentage was 57.5% that is a lot of pressure on ATL pitchers. ATL had 9 hits so 4 or 5 runs is expected which they scored 4. They had 9 hits, 2 doubles, 5 BBs, and 9 strikeouts. They had 11 total bases plus 5 BBs to make 16 opportunities. They had 37 at-bats creating an opportunities percentage of 43.2%. They put pressure on, not nearly as much as PHI did, nor did they have many extra-base hits. PHI won with ISO and pitchers limiting the ISO of the ATL.

So this is how to break down a game once it is over. The goal is to learn how to see this in advance. We want to be on the side of the most opportunities and pressure. As the season goes, data will support a deep dive into this daily. Do all the homework you can. We can not see into the future, but we can get a "feel" for it if we look at the right data. 

Sunday, March 18, 2018

The Chicago White Sox are really starting James Shields Opening Day!

2018 White Sox are in need of major league talent

The 2018 version of the Chicago White Sox are barely the vision of what they can and will be in the future.  This is a team with youthful talent that is not at the big league level yet. They are a group built to dismantle. They are several years from contending, but this year's version is just talent deficient. When James Shields is your opening day starter, that tells you all you need to know. However, let's look at it deeper.

The offense projects 29th, there are only 30 teams! 

They have only 2 batters that project with any significant offensive contributions for 2018. They are circled in red.1B Jose Abreu shows up with 19.6 OFF (RAA). He ranks above average. Avasail Garcia comes in with 6.0 OFF. He ranks average. There are 6 players highlighted. They are negative OFF players and costing the team wins! The rule of thumb is that for every 10 OFF (RAA) there is 1 win. CHW has 5 players costing them wins at or above 1 individually! Even with Abreu and Garcia earning them 2.5 wins, the team total shows -8.7 wins! 

The pitching projects 29th. I guess they did not want to show up the offense.

It is worth noting that Carlos Rodon is out for half the season. He is their best starting pitcher. Look at the highlighted areas. They have 6 of their 9 starters with a projected ERA over 5.00 and a team total over 5.00! They get no support from the relief group as they have only 2 pitchers under 4.00 projected FIP. In this case, does it really matter if 5.36 ERA James Shields is the opening day pitcher when the other veteran guy Gonzalez is 5.19 and the remainder are youngsters with no track record? This team will need to score runs to overcome the pitching and as we have seen, that will be unrealistic to imagine. The future may be bright but 2018 is almost as dark as it can get. 


MLB tiers and teams to watch

2018 MLB Team Tiers and Teams to Watch

Unquestioned the best team in MLB is the Houston Astros. They are the "Elite" tier in baseball. It doesn't mean they will coast into the World Series but there are NO challengers to how good this team is. 
2018 Tiers

 Elite
HOUSTON

World Series Contenders
New York Yankees
Washington Nationals
Chicago Cubs
Cleveland Indians
Los Angeles Dodgers

Playoff Contenders
St.Louis Cardinals
Arizona Diamondbacks
Boston Red Sox

In the Hunt
Minnesota Twins
Milwaukee Brewers
San Francisco Giants

In the Conversation
Los Angeles Angels
Seattle Mariners
New York Mets

Teams to Surprise for the Good
Oakland A's
Tampa Rays

Teams Overvalued
Los Angeles Angels
Milwaukee Brewers
Colorado Rockies

There are teams with positive "hype" that should not be thought of as ready for 2018. These teams can be "young on the rise" teams or teams that made massive upgrades in the offseason. My stance is these teams are not as good as the momentum they are getting in the press. These teams are either another year away, need to make more deals for pitching, or have a significant offense deficiency.

Don't Buy the Hype Teams
Chicago White Sox
Philadelphia Phillies
San Francisco Giants
Milwaukee Brewers

Do Buy the Hype Teams
Minnesota Twins
Oakland A's
New York Mets

Teams that will be welcome by opponents due to their poor talent, front office, or window has closed is pretty long. 

We Want to Play Them Teams
Texas Rangers
Chicago White Sox
Baltimore Orioles
Detroit Tigers
Kansas City Royals
Miami Marlins
Cincinnati Reds
San Diego Padres
Colorado Rockies


Thursday, March 15, 2018

Should handicappers look at O-Swing % or SwStr% when grading a game?


I have said this many times over. There is so much more data available to analyze, that game comparisons become complex yet produce clear advantages against bookmaker lines. It is a MUST to get analytics to create the EV positive scenarios required to make MLB wagers. Today I am talking about a pitcher's "stuff" and how we can exploit those advantages.

First of all, lets get some basic understanding of Plate Discipline concepts. These are statistics that tell us how often a pitcher or a hitter swings and makes contact with pitches.The idea is that a pitchers "stuff", which is a combination of velocity, movement, and location of pitches, can be compared to league average and with the opposing starting pitcher, thus providing a detailed view of the effect on an offense they will likely have.

There are several Plate Discipline stats however we will be using just two. We are looking at O-Swing % which is swings outside the strike zone and SwStr% which is swings and misses. O-Swing% is important because this is the rate a pitcher gets a hitter to swing at or "chase" pitches that are not strikes. It is a good indication of movement and location. SwStr% is important because it is the rate hitters swing and miss period. It is a good indication of all the aspects of velocity, movement, and location. The measurements to consider are where a pitcher ranks versus the league average. The O-Swing% avg is 30% and the SwStr% avg is 9.5%. Anything above these averages will provide EV positive to one pitcher versus the hitters. Compared to the opposing pitcher, there could be HUGE EV as one may not have dynamic stuff like the other creating a gap of who can affect the offense.

Ok now to some charts. I will post the top 15 guys in each O-Swing% and SwStr%.

                                                                        O-Swing %

Masahiro Tanaka was the best in MLB at getting swings outside the strike zone. He had almost 38% of swings at pitches that were not strikes! It should not be surprising to Sale, Kluber, and Scherzer on this list. They dominate everything that is positive analytics for pitchers. It is surprising to see guys like Ivan Nova, Dan Straily, and Martin Perez on this list. However, it does show how undervalued some guys can be thus creating that EV we are looking to pile up.

                                                                           SwStr%

This list is more important because these are the pitchers that got the most swing and misses. It should also not surprise you to see Kluber and Scherzer at the top of this list. They were the Cy Young winners last season. 

Ok so now you have seen the best in MLB but how does that create EV? So we will have a matchup and see what happens. We will not use anyone from the top 15 list. Here is a matchup I found on one of my spreadsheets from last season. This is a game where Zach Davies MIL was pitching against Edwin Jackson. The line was WSH -130 as they were the home team. Davies had a 26.9% O-Swing % and a 7.7% SwStr%. These rates are both below the average so his impact on the opponent's offense should not be great. Jackson had a 29.5% O-Swing% and a 10.1% SwStr%. His O-Swing rate is at MLB average and his SwStr rate is above average. He should be able to have an effect on the MIL offense. These are hidden edges and advantages that are not seen unless you know what to look for. This data should NEVER be used by itself. The purpose to find data that provides EV positive scenarios. I use 5 segments of starting pitcher analysis. They are Metrics, Run Prevention, Stuff, History, and Regression. O-Swing% and SwStr% fall into the Stuff segment. Velocity check and Hard hit % also are in the Stuff segment. In all, there are 19 articles in the 5 segments.This indicates that there is more involvement than Plate Discipline stats and the point is that we get clarity if we look at the proper data and know how to do use that data.  


Wednesday, March 14, 2018

Who threw what pitch the best in 2017?


Who threw what pitch the best in 2017?

I am going to use Pitch Value as the measure for this. It is a stat developed specifically to answer this question. Pitch values allow you to see how successful each pitch has been over the course of the season. It is measured by runs saved by the pitcher using that pitch. A score of zero is average, with negative scores being below average and positive scores being above average. Let's see who had the best pitches for 2017.

Let's look at the fastball first. This chart shows the top 15 starting pitchers in runs saved by usage of successful fastballs.                                       
                                                 FASTBALLS                                                   

We see Justin Verlander and Chris Sale led MLB last season. Not so surprising there. Interesting to see Andrew Cashner 3rd,  Lance Lynn 5th, and how about RA Dickey 10th! Dickey will show up because his use was very small as he is a knuckleball pitcher and his results were good. His showing on this list is sort of an anomaly. 

The best pitch in baseball is now the slider. If you have a good one, you can combine it with the fastball and dominate the league. 
                                                                          SLIDERS

Here we see Max Scherzer dominate. Notice that he also appears on the fastball chart. He did win the Cy Young in 2017 so this is indications of why. Marcus Stroman maybe an underrated performer too. He appears on the tops in both lists. It is no surprise to see Clayton Kershaw appear on both. Luis Severino just missed as he was 18th on the fastballs list. 

The next chart is cutters (cut fastballs). There are only 18 qualified starters who threw this pitch so I will include them all.
                                                                        CUTTERS

Mike Leake, Jon Lester, and Corey Kluber lead the way here. This pitch is not resulting in many good outcomes with only 5 pitchers above average. Did you notice that Marcus Stroman made another list? In this case, it is not a good result. 

Now to the curveballs. This is a staple in a pitchers arsenal so let's see who had the best one.

                                                                 CURVEBALLS

WOW! Corey Kluber has the BEST in baseball! He saved 37.8 runs using this pitch. Interesting to see Aaron Nola #2 on the list. Clayton Kershaw makes another positive list in the top 15 (that make 3 charts for him). It is also interesting to see the CLE big three starters are all on this list. 

Now let's look at changeups. Another staple of quality pitching is the off-speed stuff.
                                                             
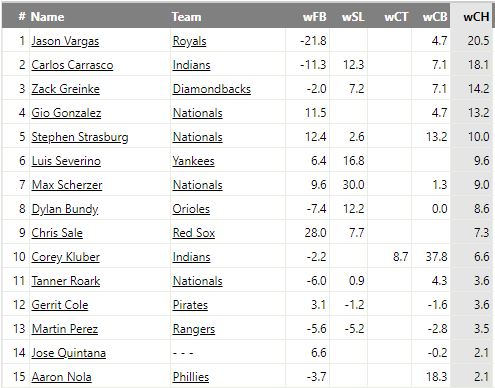
                                                                   CHANGEUPS

Jason Vargas is #1 on the list. He was extremely hot to start 2017 but faded down the stretch. He had the changeup in MLB last season. Notice the hard throwers that are on the changeup list. Strasburg, Severino, Scherzer, Sale, etc. They are great because they mix the tempo of the hitters' swings producing the outs. By the way, Kershaw finished 18th just missing another list!

These were the very best pitches used by starting pitchers. It might be interesting to look at the failures too. I will just post the charts with no commentary but remember these will be costing their teams runs. 

                                                             BAD FASTBALLS                                                               


BAD SLIDERS


BAD CURVEBALLS

  BAD CHANGEUPS